
 What does shipping data analytics have to do with gardening?
I’ve had a vegetable garden for years. At our last home, it thrived. But since moving six years ago, my garden hasn’t produced nearly as well. We assumed it was a watering issue and tried everything—longer watering times, more frequent cycles, even replacing irrigation lines.
We made progress, but the results were still inconsistent. So this year, we decided to stop guessing and start measuring. We bought moisture meters and soil testers to finally understand what was happening below the surface.
Data backed improvements is a mindset that applies far beyond the garden. In shipping, too many businesses make changes based on assumptions—upping budgets here, tweaking carriers there—without clear data to guide the direction. Shipping data analytics makes all the difference here. It brings clarity to complex systems, helping businesses discover what’s working, what’s not, and where to plant new strategies for growth.
What is shipping data analytics?
Shipping data analytics is the process of collecting, analyzing, and interpreting shipping-related data to improve operations and reduce costs. It draws from a wide range of shipment data sources like transit times, carrier performance, and shipping costs to identify trends, forecast demand, and flag inefficiencies.
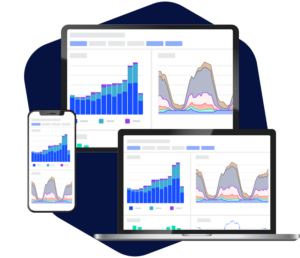
Modern shipping analytics platforms use a mix of cloud-based tools, APIs, and dashboards to make this data visible and actionable. Common types of shipping data analyzed include information such as the following:
- Shipping costs by carrier or zone
- Delivery success rates
- Average transit times
- Problematic routes or regions
When analyzed holistically, this data becomes fertile ground for operational improvements as it sheds a light on inefficiencies and uncovers opportunities to streamline fulfillment.
The business value of shipping analytics
Shipping data has deep strategic value across the entire business. When analyzed thoughtfully, it can reveal hidden inefficiencies and lay the groundwork for sustainable growth. Just like understanding soil conditions can transform a struggling garden, understanding your shipping performance can help your business thrive from the inside out.
Strategic advantages for executive decision making
Shipping analytics give executives a high-level view that fuels smarter decisions. From identifying margin-draining shipping lanes to improving competitive positioning, the insights enable sharper financial planning and more accurate forecasting.
Risk management and compliance benefits
Having analytics in place allows businesses to more easily detect fraud, flag unusual patterns, uncover inefficiencies, and stay in step with regulatory requirements. Putting data to work helps create a healthy ecosystem where transparency and accountability thrive.
Long-term business sustainability impacts
Complexity grows side-by-side with a business. Shipping analytics helps scale operations intelligently, anticipating bottlenecks before they take root and monitoring environmental impact to support sustainability initiatives.
How shipping analytics benefit fulfillment operations
Data-backed fulfillment practices are more efficient and stay ahead of demand. Relying on guesswork or outdated trends, on the other hand, leaves teams reacting to problems rather than preventing them. When you put shipping analytics to work, you create an environment where every part of your operation can grow stronger with the right information at the right time.
Warehouse workflow optimization
Analytics highlights when volume peaks happen and where bottlenecks form, allowing teams to adjust labor and streamline pick-and-pack processes. Instead of overwatering some areas while others go dry, you allocate resources where they’re most needed.
Order processing enhancements
Data helps optimize batch processing and enables intelligent service-level selection, ensuring each order gets the most efficient and cost-effective route to the customer.
Inventory placement and distribution benefits
By understanding shipping trends, businesses can forecast regional demand and strategically place inventory closer to high-volume areas. It’s like moving your crops to the sunniest part of the yard for better yield.
Billing accuracy and cost recovery
Shipping invoices aren’t always right, and most teams don’t have the visibility or bandwidth to audit every one. Analytics surfaces cost discrepancies across carriers and international markets. Whether it’s misapplied surcharges or mismatched parcel weights, these hidden errors add up fast. With the right data, businesses can identify the root cause, recover costs, and prevent future loss.
Returns logistics optimization
Analytics enables smarter returns handling from identifying frequent return causes to automating the routing of returned goods. This helps reduce unnecessary shipping and improves customer satisfaction.
Key shipping metrics and KPIs to track
To grow a high-performing logistics strategy, you need the right indicators. These metrics are some of the most valuable to keep an eye on:
- On-time delivery performance: The percentage of deliveries that arrive within the expected window of time.
- Delivery success rate: The number of packages that make it to the right place, on time, the first time.
- Average delivery time by service level: Actual vs. promised performance for 2-day, overnight, etc.
- Carrier speed comparison: Evaluation of which carriers deliver fastest for specific lanes.
- Package exception rate: The percentage of shipments flagged with delivery exceptions such as damaged, held, customs delays, etc.
- Problem regions or routes: Areas that consistently cause issues, so you can fix the root problem rather than just the symptoms.
- Weight and dimension variance rate: How often actual parcel weights/dims vary from what’s declared.
- Post delivery complaint rate: The percentage of orders that result in support tickets or complaints after delivery, even if it was technically “successful.”
Cost metrics like total shipping spend, cost per package, and hidden fees are also crucial to track. And carrier performance metrics, such as service level adherence and rate optimization success, show whether your logistics partners are delivering what they promise.
Finally, customer satisfaction metrics like delivery experience ratings, reorder correlation, and complaint volumes, tie your shipping operations directly to the customer experience.
EasyPost Analytics
EasyPost Analytics is the industry’s first analytics-as-a-service platform designed specifically for shipping. It brings together data from across your operations—from warehouses to last mile—and turns it into clear, real-time insights.
It includes the following four solution modules:
- Omnichannel Analytics
- Parcel Visibility
- Warehouse Analytics
- Supply Chain Cost Management
With a cloud-based interface and pre-built dashboards, EasyPost Analytics makes it easy to dig into the data without digging through spreadsheets. It integrates with your existing tools and gives your team near real-time access to metrics that matter.
Case study: EasyPost Analytics saves $1M per month
Challenge
A global luxury jewelry company struggled to translate shipping and delivery data into real-time insights, especially during high-volume times like Mother’s Day.
How we helped
We helped the company consolidate their data into a central dashboard, enabling greater visibility into its shipping operations.
Results
They found discrepancies in cost when shipping between the U.S. and Canada, saving approximately $1 million per month. The company was also able to proactively address delivery delays to enhance the customer experience.
Put your shipping data to work
Growth doesn’t happen by accident, whether you’re tending tomatoes or optimizing a supply chain. It happens when you stop guessing and start measuring.
Ready to make smarter decisions? Learn more about EasyPost Analytics and see how real-time insights can help your business thrive from warehouse to doorstep.