
When you think of EasyPost, we hope that “data” is one of the first words that pop into your head. We utilize data across the board to help businesses worldwide power their dynamic shipping needs. Taking our huge inventory of data one step further, we created a new EasyPost analytics dashboard to visually represent insights on our customer’s shipping programs.
The first iteration of the new dashboard trends includes label volume, shipping spend, and average cost per label over time. The current and upcoming filtering and sorting features help to pull insights and anomalies efficiently.
Shipping managers can now save time by using the dashboard for internal reporting needs and quickly answering time-sensitive questions. The dashboard updates in real-time so it is especially helpful to keep a pulse on recent trends.
Use our support center article for a deep dive on how to use the dashboard.
Analytics dashboard overview
The analytics page now serves as the new default dashboard page for EasyPost users. Users can navigate back to the dashboard after leaving by clicking the “Analytics” tab.
Shipping trends charts
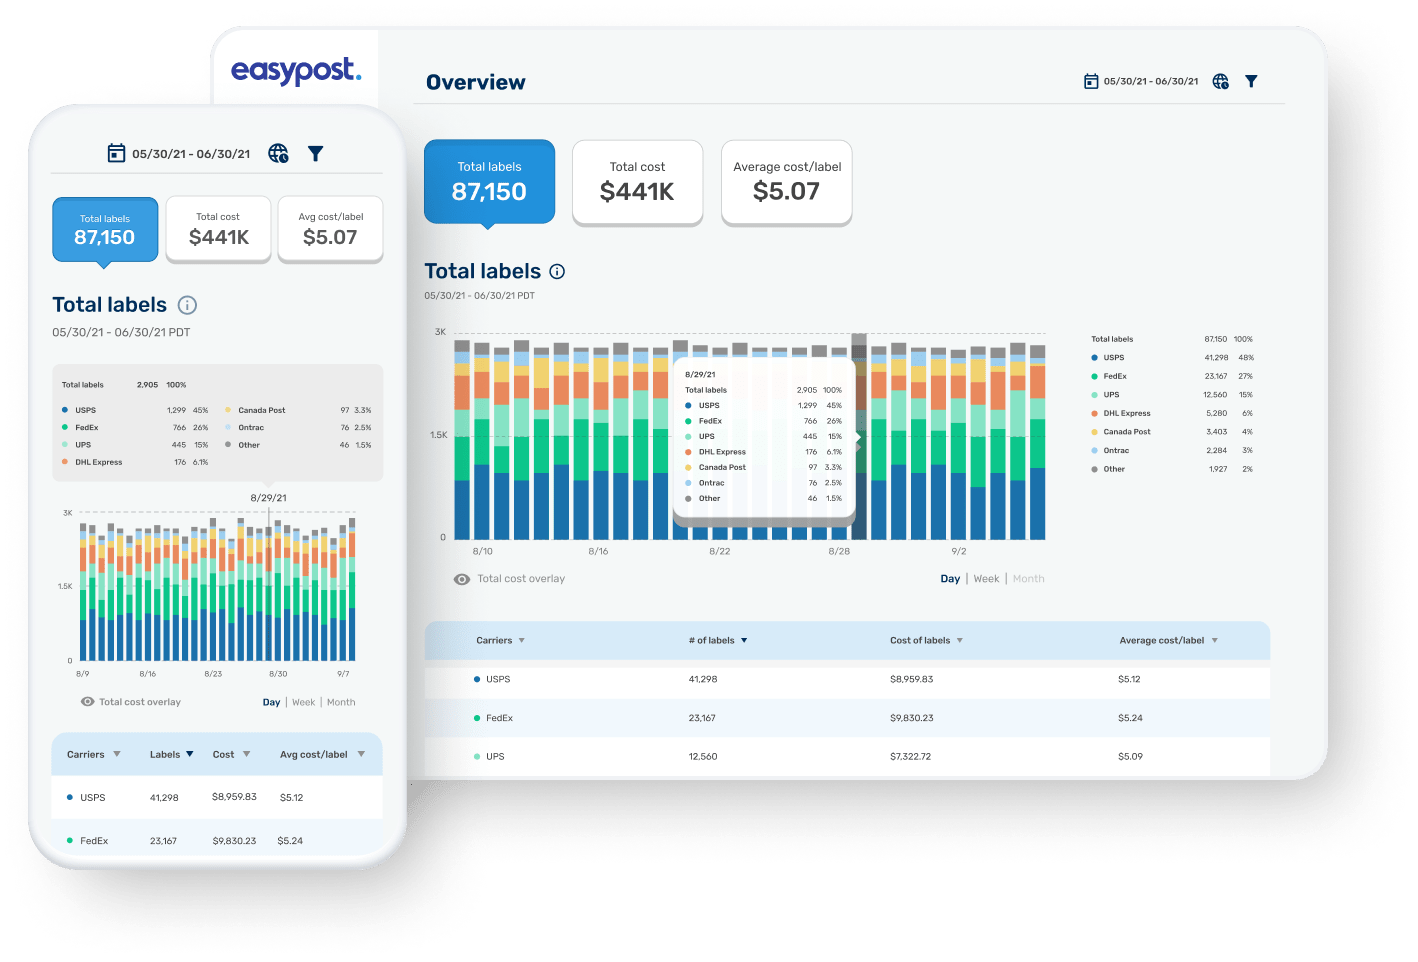
Users can use the shipping trends charts to view total labels, total cost, and average cost per label over a customizable period (displayed below). The dashboard’s granularity is flexible and can be customized to the hour, day, week, month, or year. Trends and anomalies can be easily identified by seeing a large spike in a specific period. Additionally, the dashboard will soon include a carrier filter that will make it easy to identify trends from specific carriers.
Shipping trends table
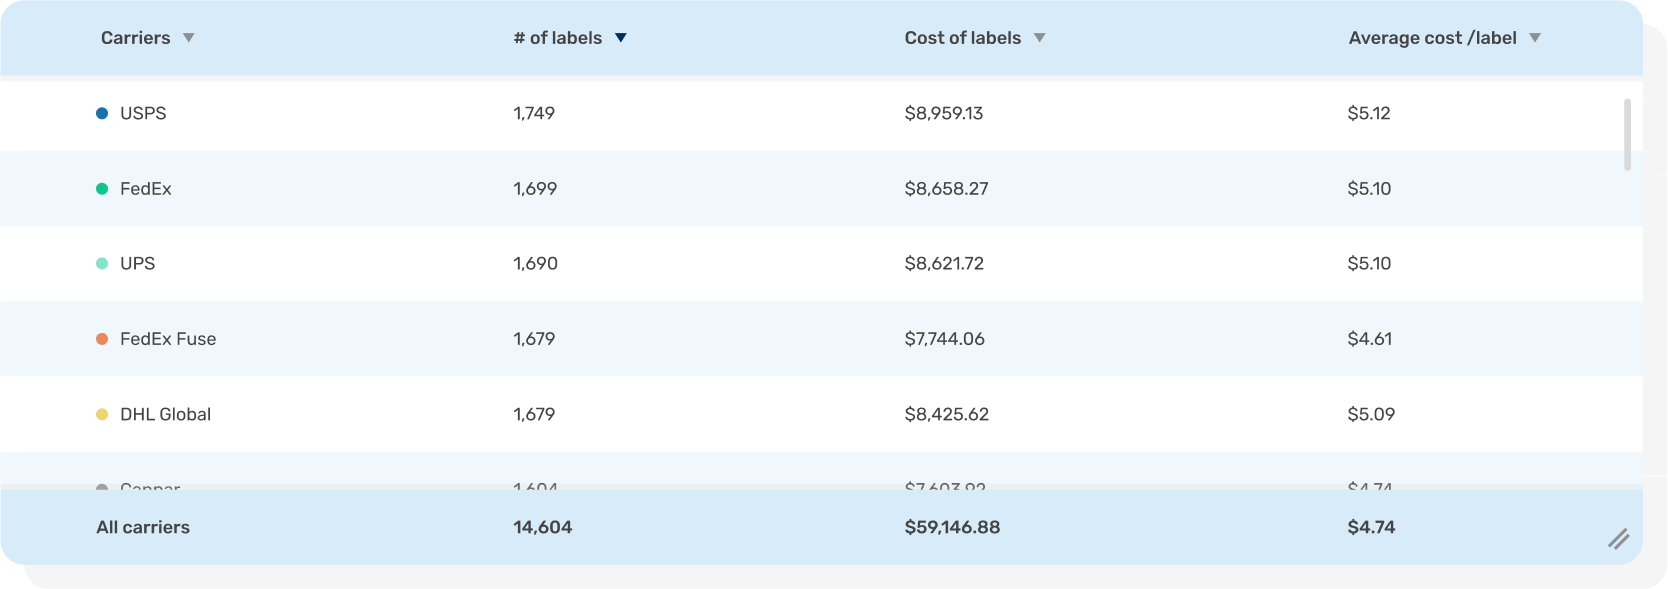
The analytics dashboard summarizes the same data in the shipping trends charts in a tabular format (displayed below). The table breaks down metrics by carriers to allow for a more seamless comparison. Additionally, data can be easily sorted which allows users to quickly answer questions and pull needed metrics.
Stay tuned for additional features and updates
We will continue to add more widgets and functionality features to the dashboard. Feel free to leave us feedback; it helps us to improve future iterations of the dashboard!